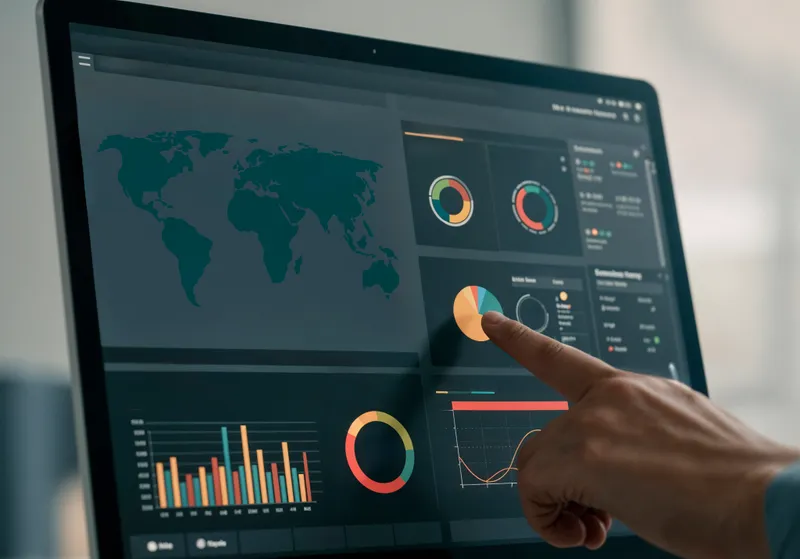



MercExe dynamic dashboard with category widgets

Dashboard and Reporting

A dashboard you build, reports you can file

Add widgets by category, size them, and filter by facility and date. When you need the detail, Reports runs sales, purchase, inventory, aging, and GST from the same documents.

From live view to filed report

Dynamic dashboard, then the Reports menu

Dashboard is the first screen after login. You pick a category, add the widgets that matter, and keep that layout. Reports is the list you print, export to Excel, or save as PDF.

  1. 01Categories
  2. 02Widgets
  3. 03Filters
  4. 04Reports
  5. 05Export

Dynamic

Add, size, and arrange widgets

Each category starts from a default layout. Add Widget places another tile from that category. Resize width and height, move tiles forward or back, or remove a widget. The layout is saved per category so the next login looks the way you left it.

  • Add Widget from the category catalog
  • Width 1 to 5, height 1 to 4
  • Empty category: add the first widget to start the view
Dashboard widgets you can add, resize, and rearrange

Scope

Facility and date on every widget

One facility picker and one date range apply to the active category. Choose a site or all facilities. Presets cover today through last year, or set a custom from and to date.

  • All facilities, or one facility
  • Today, this week, last 30 days, month, quarter, year, or custom
  • Widgets refresh for the selected range without leaving the dashboard
Dashboard filtered by facility and date range

Six category boards

Widgets for how you actually run the chain

Switch tabs on the same dashboard. Each tab has its own widgets and layout.

Sales and revenue dashboard widgets

Sales and POS

Sales & Revenue and POS Performance sit side by side: totals on the desk, productivity at the counter.

  • Gross vs net, basket value, payment split, top items, sales summary
  • Sales by location, cashier productivity, peak hours, void and cancel audit

Order and purchase dashboard widgets

Orders and purchase

Order Management and Purchase Orders show work in flight — what to fulfil, what is still open with vendors.

  • Actionable orders and sales orders per day
  • PO status, open PO value, overdue deliveries, procurement spend, purchase categories
Financial and inventory dashboard widgets

Money and stock

Financial & Liquidity and Inventory & Operations keep cash, aging, and stock risk on the same home screen.

  • Daily cash flow, AR aging, accounts payable, tax liabilities
  • Low stock alerts, dead stock, inventory by category, item summary

Reports menu

The same documents, listed for audit

Reports is a separate menu from the dashboard. Open a report, set dates and party, then read the rows that posted from sales, purchase, stock, and GST.

  • Sales by customer or item; invoices, estimates, orders; sales and receipt day books
  • Purchase by vendor or item; bills, POs; purchase and payment day books
  • Inventory stock and count variance
  • Receivables and payables by party, with aging
  • GSTR-1, GSTR-2, GSTR-3B, and GSTR-9
Sales, purchase, aging, and GST reports in one Reports menu

Take it with you

Excel, PDF, and print

From a report, export Excel, download PDF, or open print preview. GST reports can export more than one sheet. The file is the same numbers you see on screen.

Export dashboard reports to Excel, PDF, or print

Why dashboard and reporting in MercExe

You choose the tiles

Not a fixed poster. Add, size, and drop widgets per category so each role sees a different board.

One filter, all widgets

Facility and date apply across the active category. No re-running each chart by hand.

Reports match the documents

Day books, aging, stock, and GSTR read the same sales, purchase, and GST postings as the rest of MercExe.

Export when someone asks for a file

Excel, PDF, and print stay on the report. The dashboard stays for the live view.

See your widgets and a GST report on MercExe

Walk through a category dashboard and a day book or GSTR export with a product specialist.

Request a demo